

3D Mapping Database Aided GNSS RTK and Its Assessments in Urban Canyons
IEEE Transactions on Aerospace and Electronic Systems (2021)
Summary
3D building models are used inside RTK processing to predict and exclude NLOS satellites before they corrupt ambiguity resolution.
Figures
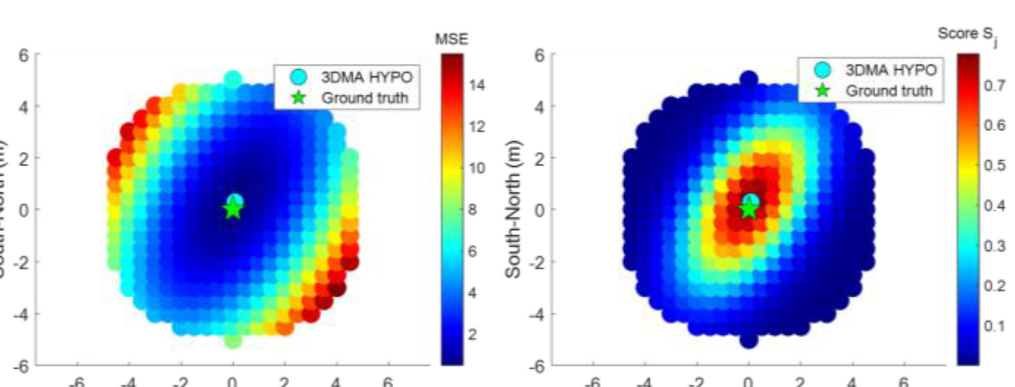
After the pipeline defines 3D-map-aided RTK, this heatmap shows how candidate positions are scored before ambiguity resolution.
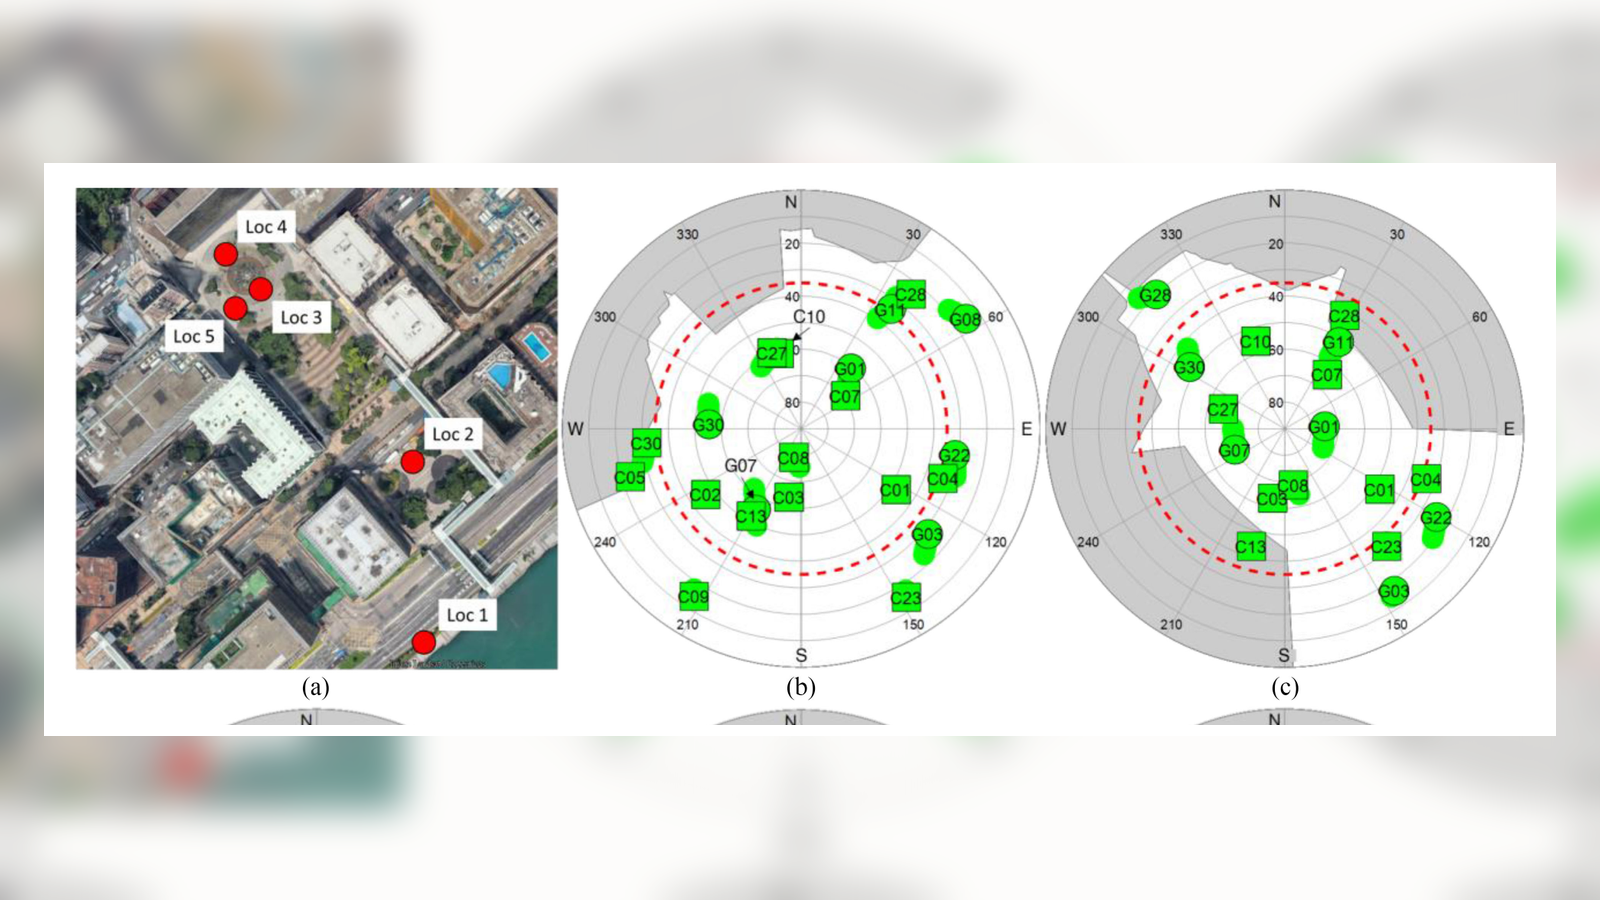
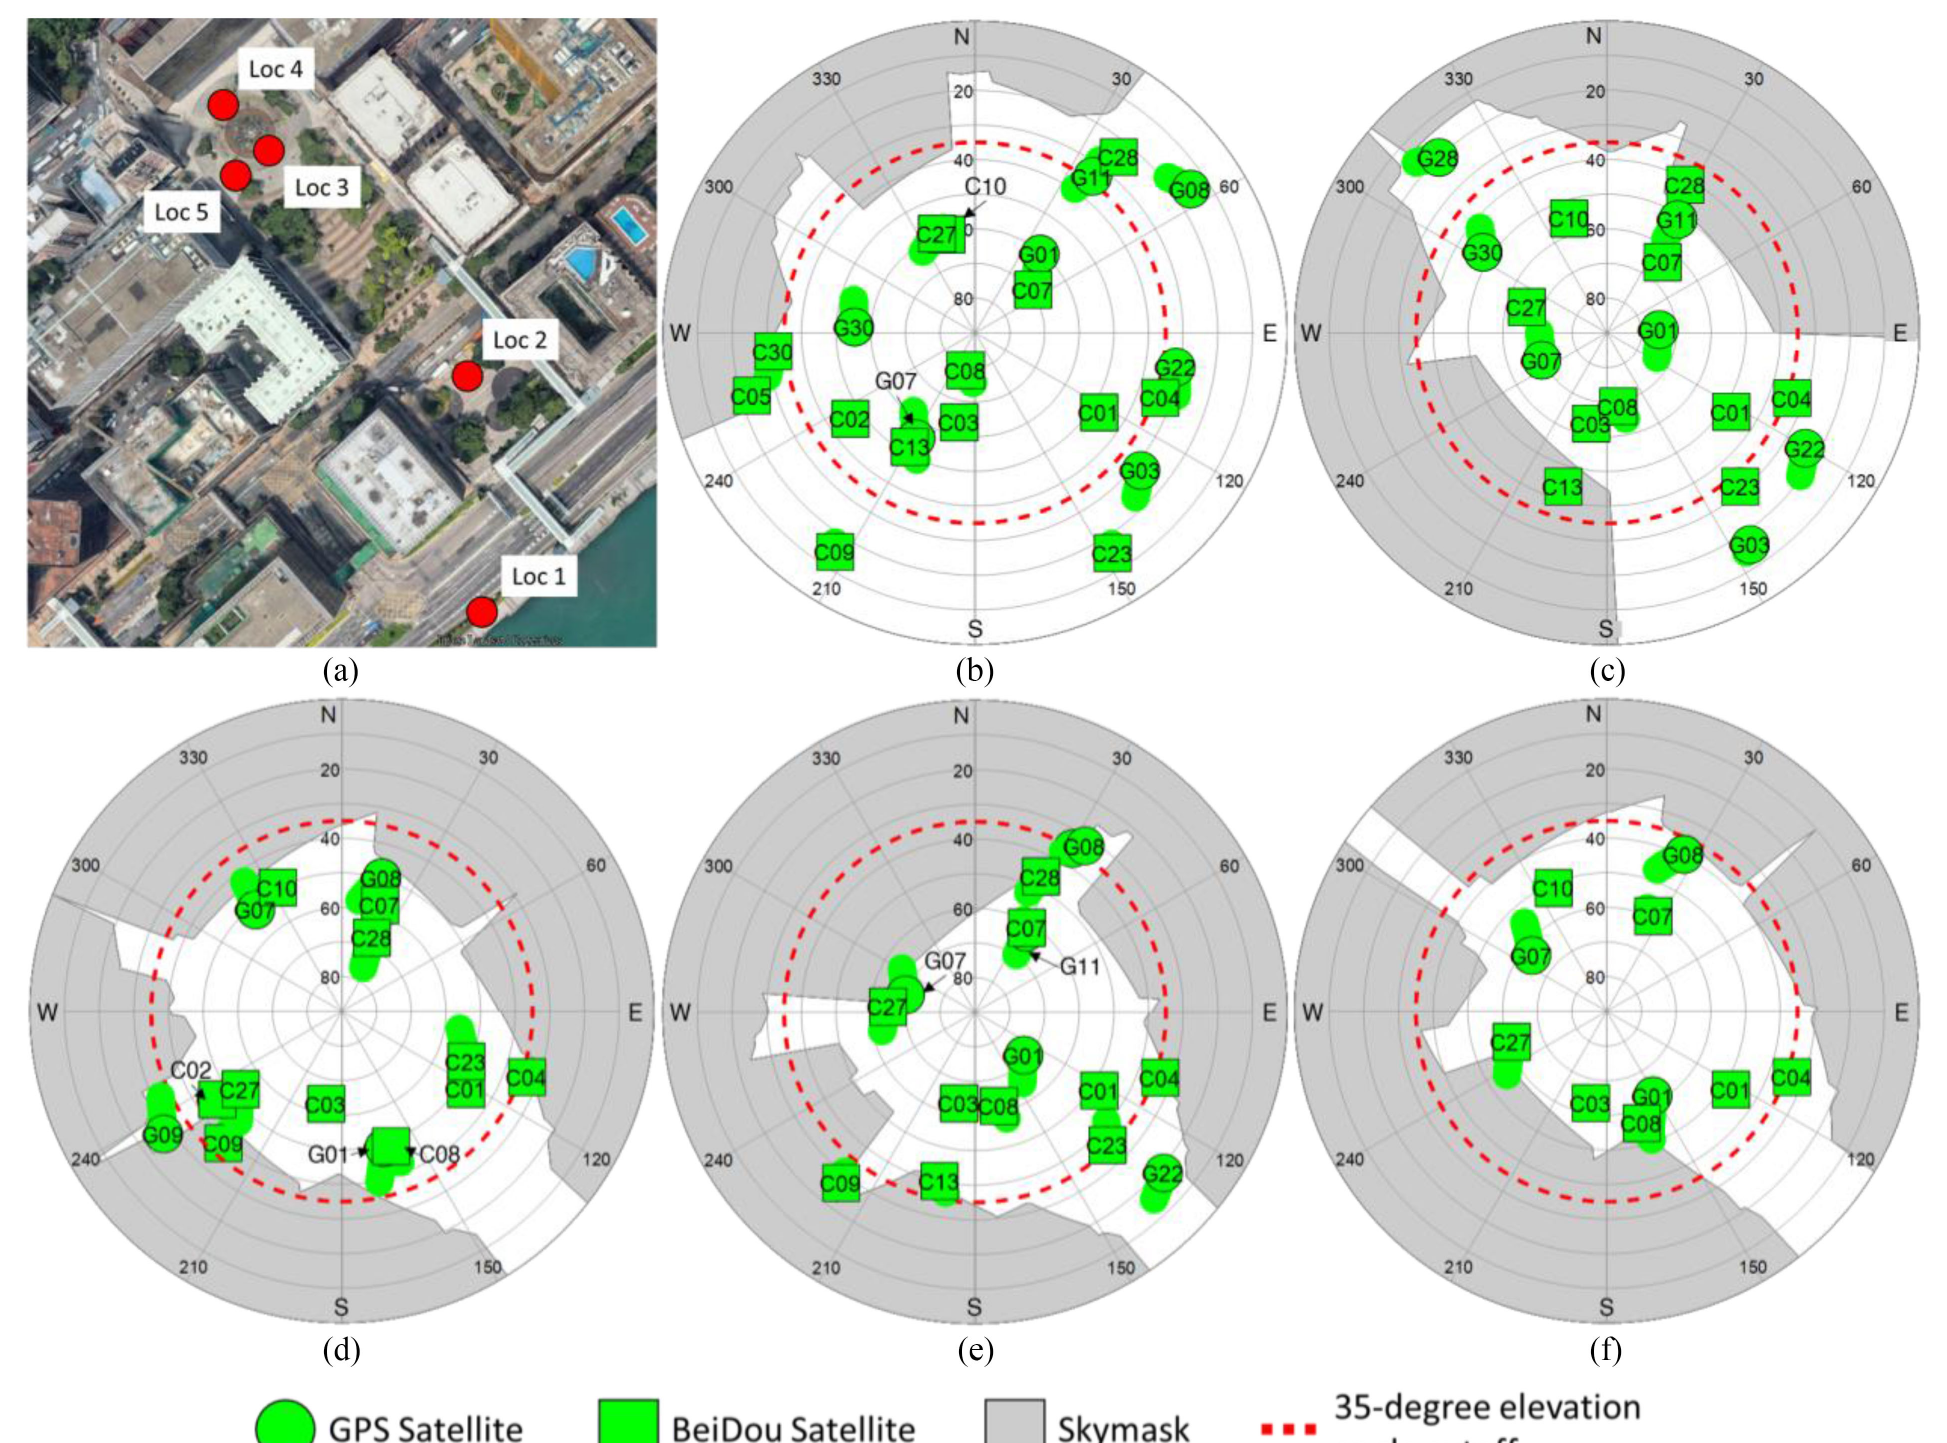
The paper then tests the method across Hong Kong sites with different skyline obstruction patterns, making skymasks central to the evaluation.
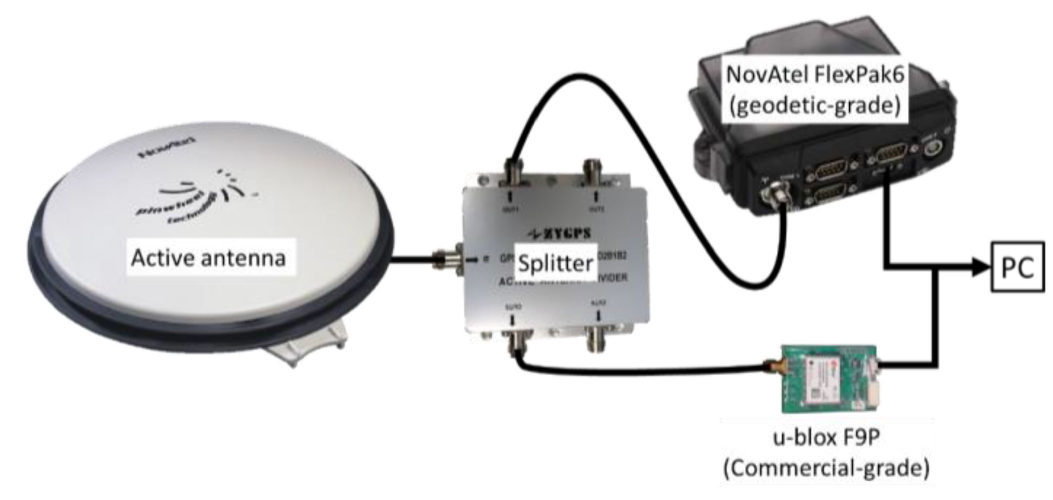
The shared antenna and receiver setup lets the study compare geodetic and commercial receivers under the same satellite environment.
With the experiment fixed, the paper links positioning error to ambiguity dilution, geometry dilution, and satellite availability over time.
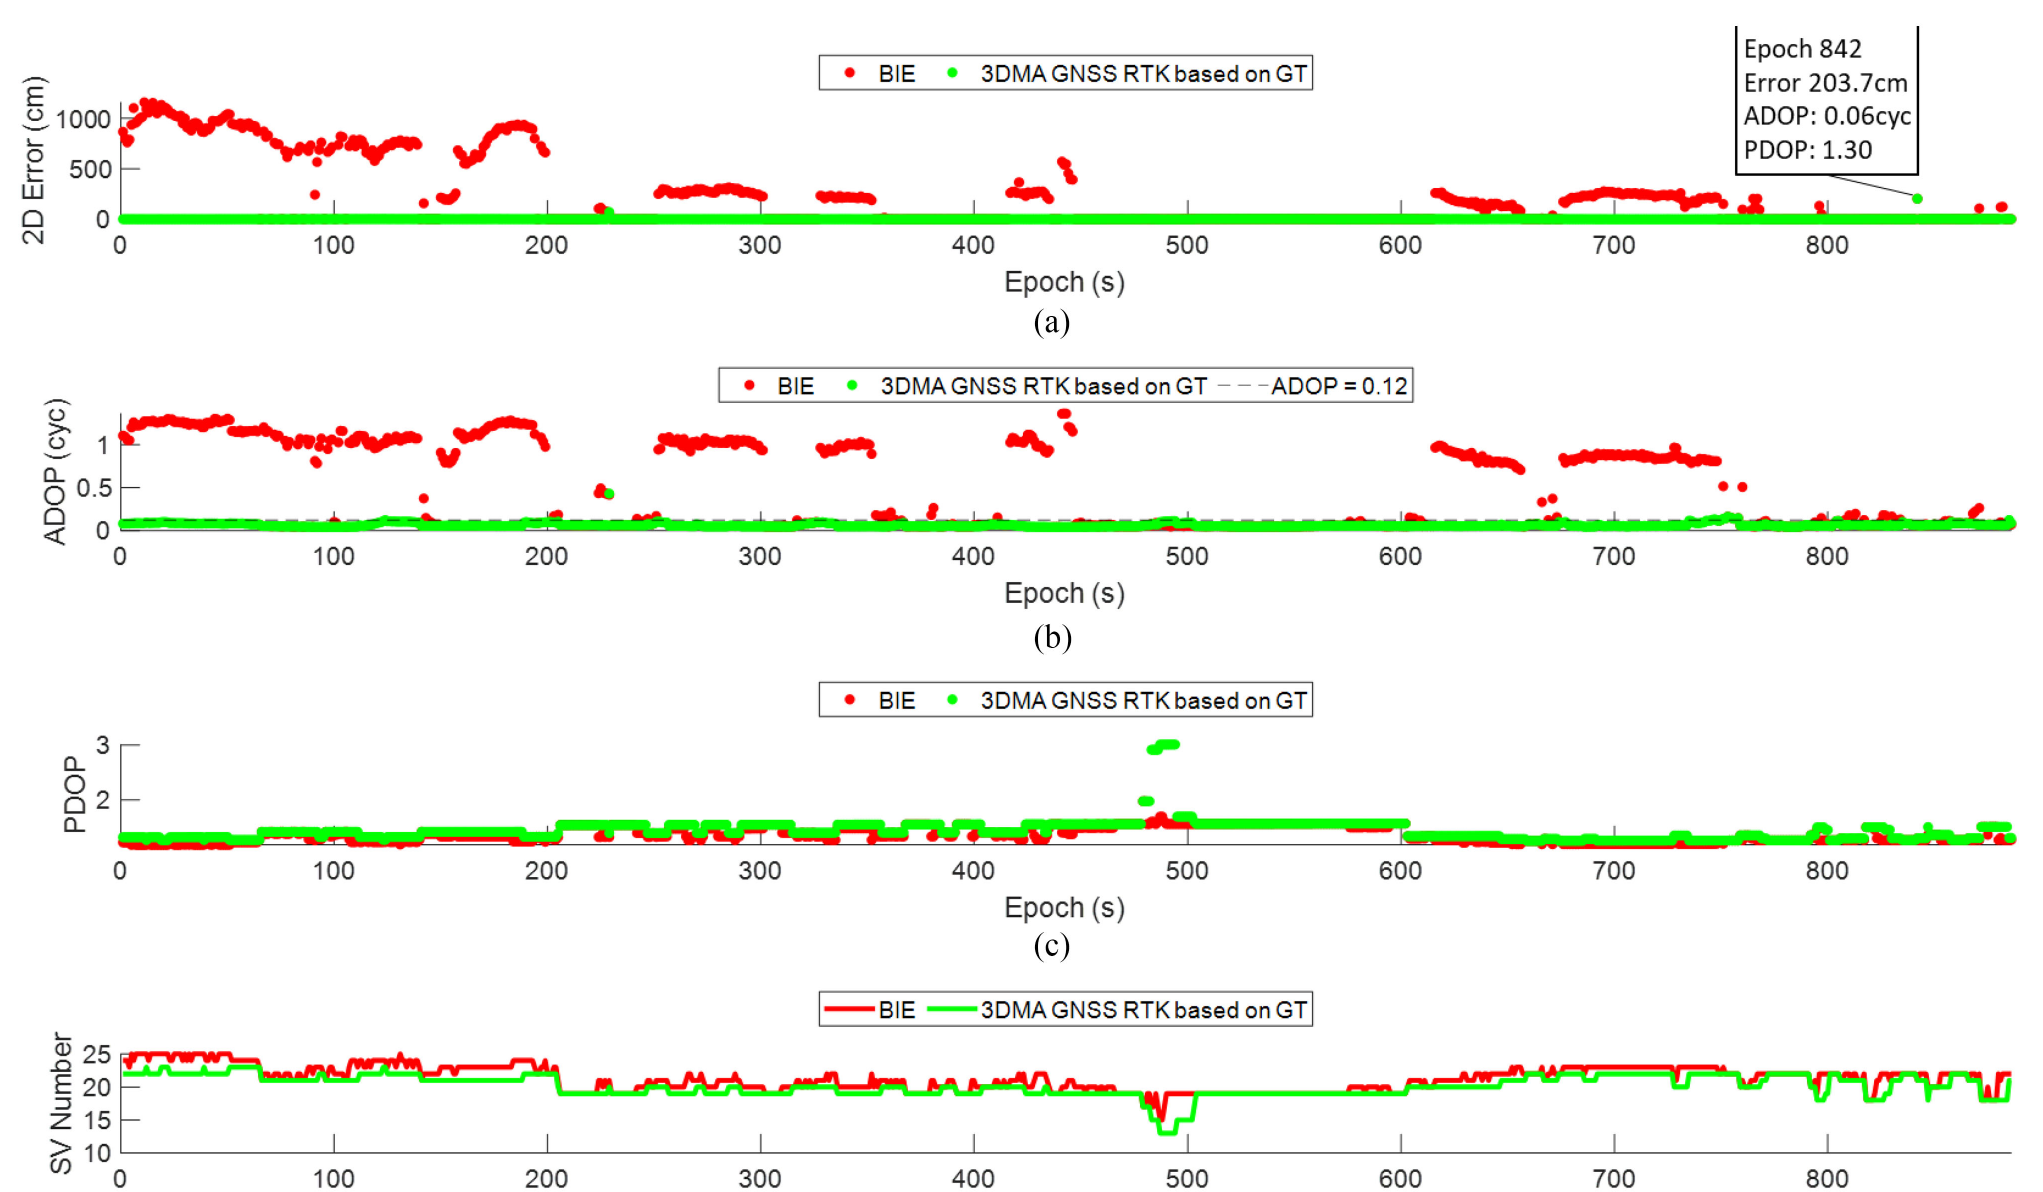
The time-series behavior is summarized statistically to show how often the 3DMA-aided RTK solution improves the 2D error distribution.

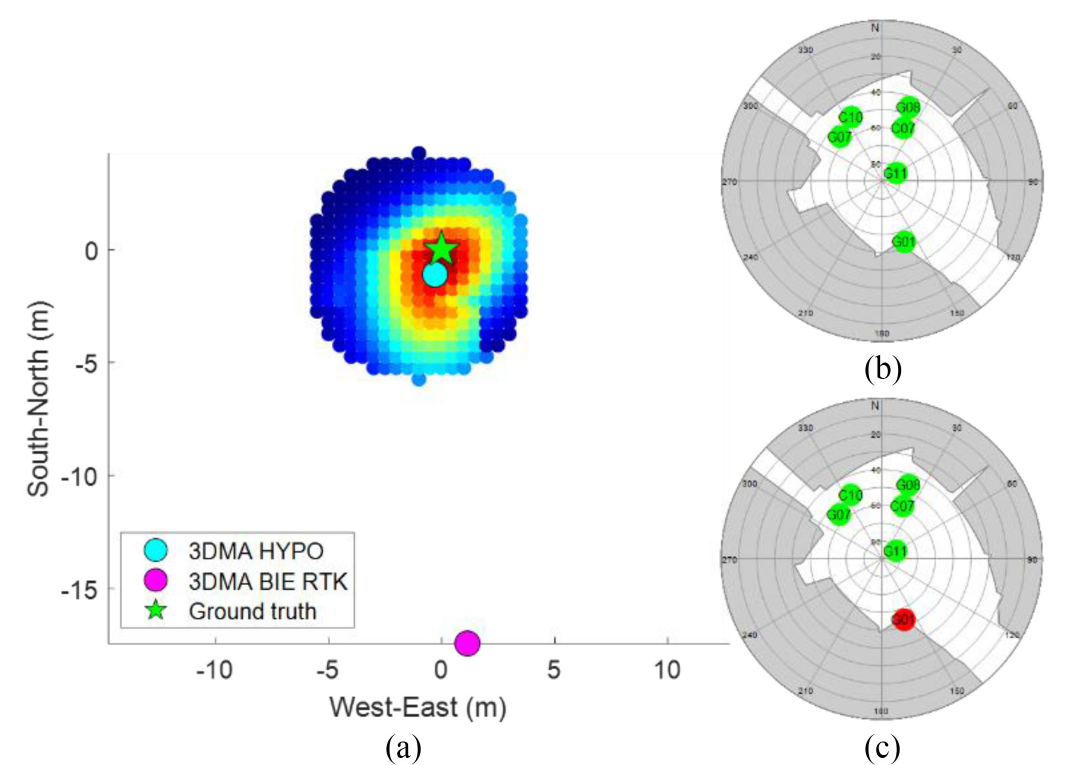
This diagnostic case explains the scoring behavior by comparing the position heatmap and visibility decisions at candidate locations.
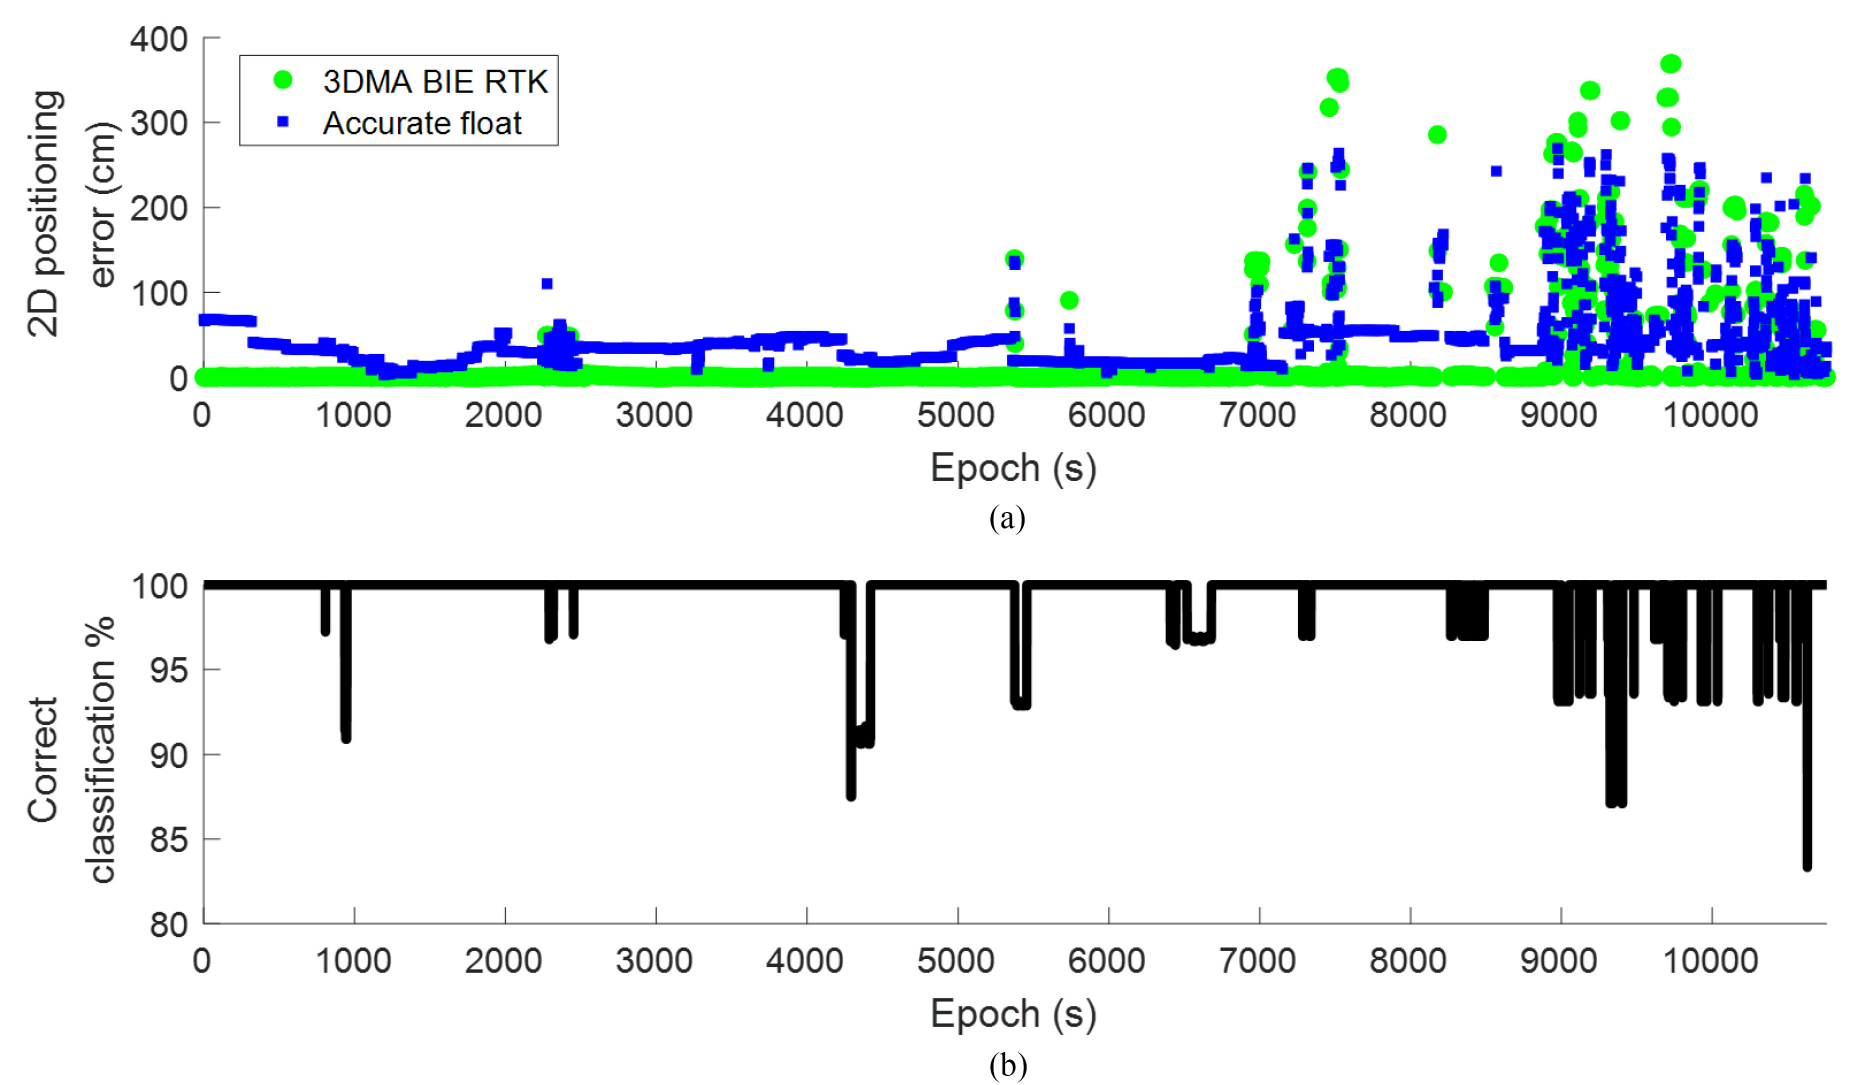
The long-duration test checks whether the same visibility-based logic remains stable over several hours of urban data.
Key idea. Carrier-phase RTK collapses in urban canyons because reflected (NLOS) signals corrupt ambiguity resolution. This work brings a 3D building model into the RTK engine to predict and exclude NLOS satellites before they poison the solution.
Impact. It demonstrated that map-aware RTK can hold centimetre-class fixes in environments where conventional RTK fails — a building block of the lab’s 3D-mapping-aided GNSS line and its smartphone/automotive applications.